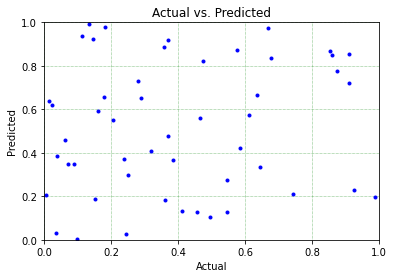
df = pd.DataFrame()
df["Actual"] = np.random.random(50)
df["Predicted"] = np.random.random(50)
sc = scatter2D('b', marker='.')
fig = sc.plot(dfx=df, dfy=df, x="Actual", y="Predicted")

dec = decorator(title='Actual vs. Predicted',xlabel='Actual', ylabel='Predicted',
                xlim= (0,1), ylim=(0,1), grid=True,
                grid_color='g', grid_linestyle=':', grid_linewidth=0.5)
fig = dec.fit(fig)
# print(type(fig))
sa=SavePlot(filename='Parity',output_directory='images',
            kwargs={'facecolor':'w','dpi':330,'pad_inches':0.1, 'bbox_inches':'tight'})
sa.save(obj=fig)
fig.show()
